
Lowered Graphics Settings but FPS Didn't Improve? You're Probably Tuning the Wrong Bottleneck
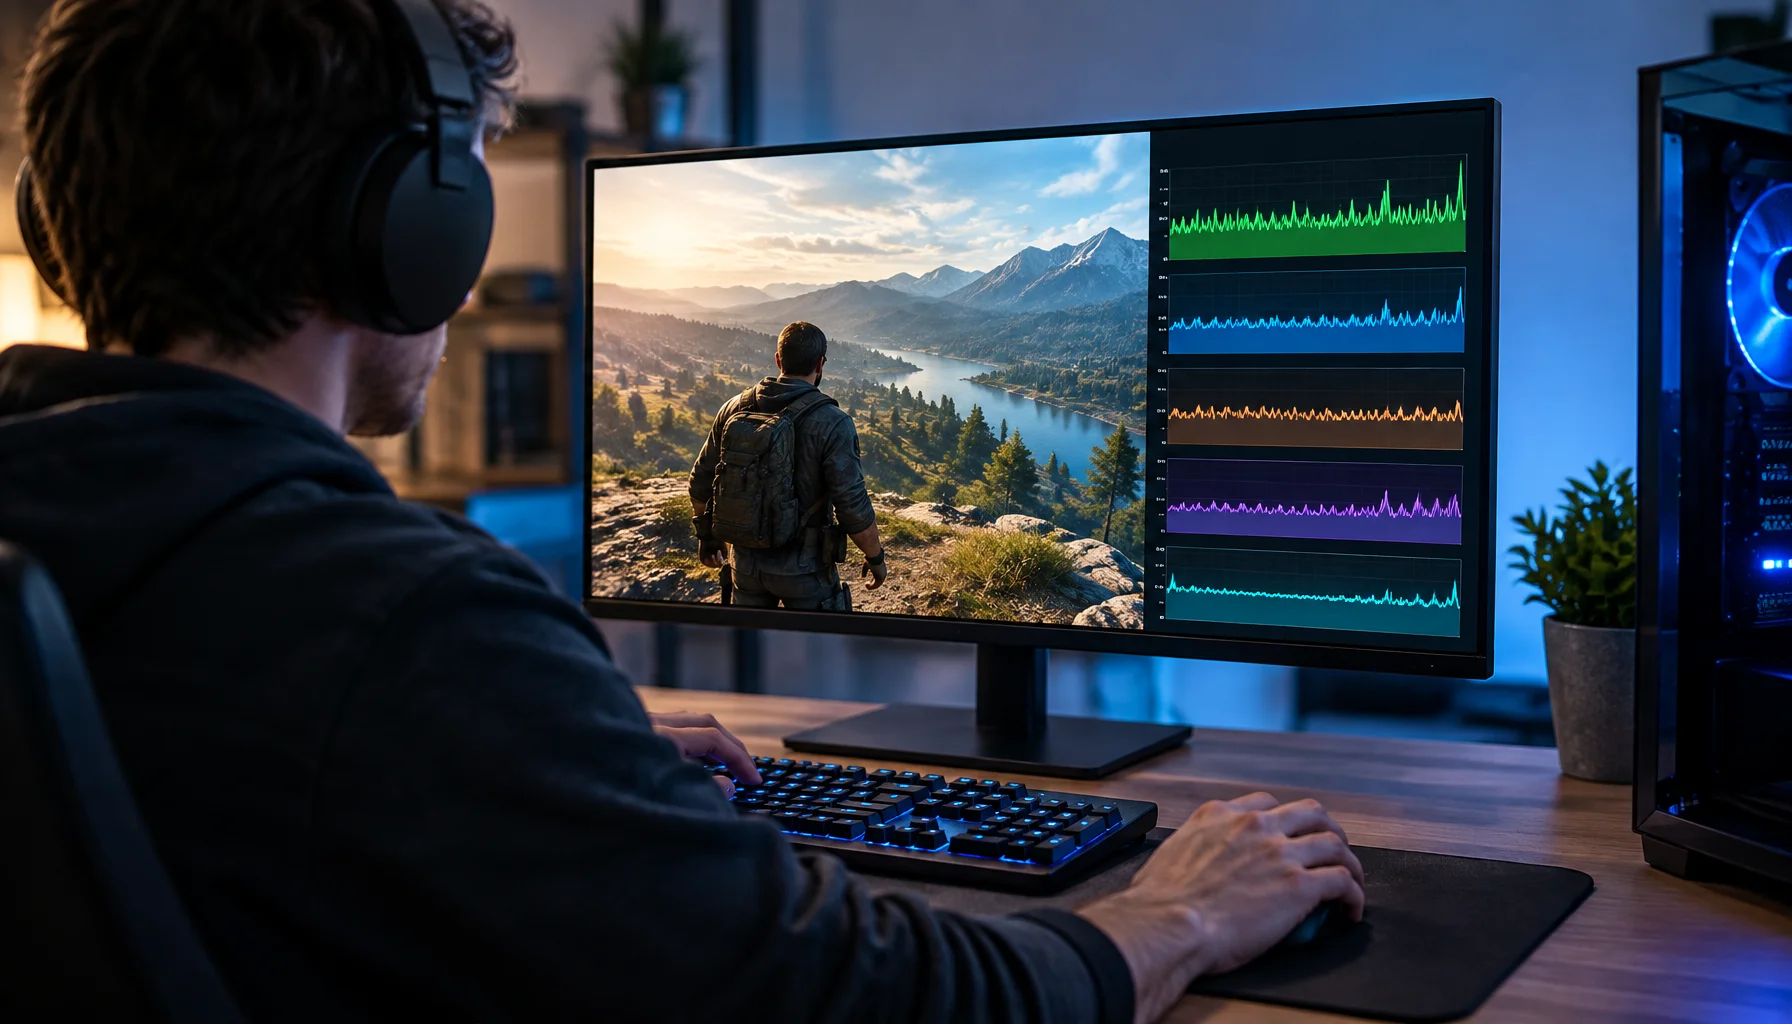
You lower shadows, textures, effects and even resolution, but the FPS barely moves. That does not necessarily mean the settings are broken. It often means the setting you changed was not stressing the component that is currently limiting performance.
A graphics preset is not a universal performance knob
Graphics menus group many different workloads under one screen. Some settings mainly increase GPU work. Others increase CPU work, memory traffic, asset streaming or both.
Lowering resolution is a good example. It usually reduces the number of pixels the GPU must shade. If the GPU was the limiting component, FPS can rise substantially. If the CPU was already taking longer to prepare each frame than the GPU took to render it, reducing pixel work may leave the final frame rate almost unchanged.
Intel's own CPU/GPU bottleneck guidance makes this distinction explicit: lowering resolution can free GPU resources, while settings such as draw distance can influence CPU performance. The effect depends on the scene and workload rather than on a single universal “low preset = faster” rule.
The Bottleneck Response Test
Use setting changes as a diagnostic experiment
Why lowering resolution is such a useful test
Resolution changes the amount of pixel work the GPU performs. That makes it one of the clearest first tests for separating a strongly GPU-limited situation from one limited elsewhere.
What a large resolution change can tell you
| Observed result | Likely interpretation | Next step | |
|---|---|---|---|
| Large FPS increase | FPS rises strongly | GPU rendering load was an important constraint | Tune GPU-heavy settings, resolution, upscaling or image-quality trade-offs |
| Small FPS increase | FPS barely changes | CPU, simulation, frame cap, streaming or another non-pixel workload may be limiting | Inspect CPU/GPU timing and CPU-sensitive settings |
| Mixed response | Average rises but lows/stutter do not improve | GPU throughput improved but the slow-frame cause remains elsewhere | Inspect frame-time spikes, streaming, CPU scheduling and memory behavior |
| No response at a fixed ceiling | FPS stays exactly at the same ceiling | A frame cap, V-Sync limit or engine cap may be active | Identify the limiter before changing quality settings further |
CPU-bound does not mean “the CPU is at 100%”
A common mistake is to look at total CPU utilization and conclude that the CPU cannot be the bottleneck because it shows 40 or 60 percent.
Games do not necessarily distribute their most important frame work perfectly across every core. One or a few critical threads can determine when the next frame can be submitted even while other cores remain less busy.
Intel recommends CPU/GPU balance analysis rather than relying on one utilization percentage. PresentMon's GPU Busy metric is specifically designed to help evaluate how much of the frame interval the GPU is actually executing work.
The Setting Sensitivity Map
| Setting class | Often stresses | Why FPS may or may not respond |
|---|---|---|
| Resolution / render scale | Mostly GPU pixel workload | Large response when GPU-limited; little response when CPU-limited |
| Ray tracing / heavy lighting | GPU | Can strongly reduce GPU frame time when lowered |
| Shadows | GPU, sometimes CPU | Depends on shadow distance, object count and engine implementation |
| Draw distance / object distance | CPU + GPU | More objects can increase submission, simulation and rendering work |
| Crowd / NPC density | Often CPU + GPU | AI, animation and simulation can increase CPU-side cost |
| Textures | VRAM / memory bandwidth more than pure compute | May affect stutter or memory pressure without large average-FPS changes |
| Effects / volumetrics | Mostly GPU | Often useful when GPU execution time is high |
| Physics / simulation quality | Often CPU | Can remain expensive even at low resolution |
| Upscaling | GPU workload and image pipeline | Useful mainly when GPU-side rendering cost is significant |
Low GPU utilization can be a symptom, not the disease
If the GPU is waiting for the CPU or another upstream part of the pipeline, GPU utilization can fall even though the frame rate is low.
Intel describes this general pattern as a bottleneck: one component limits another component's ability to reach its potential. Its developer guidance also shows CPU-bound scenarios in which the GPU is idle while waiting for CPU work.
That does not mean every 70-percent GPU reading proves a CPU bottleneck. Frame caps, loading, menus, power management, telemetry behavior and scene transitions can all affect utilization. Timing is stronger evidence than a single percentage.
Why higher GPU utilization is not always the goal
A GPU at 99 percent utilization can be perfectly normal when the goal is maximum image quality or throughput. A GPU below 99 percent can also be perfectly normal when the frame rate is capped or the game is intentionally leaving headroom.
The useful question is not “How do I force 100% GPU?” It is “What is preventing the frame from completing sooner, and do I actually need it to complete sooner?”
Frame caps can make settings look ineffective
If a game is capped at 120 FPS and already reaches 120 FPS, lowering graphics settings cannot make the displayed frame rate rise above that cap.
The extra headroom may still matter: GPU load, power consumption, fan noise or latency behavior can change even though the FPS counter remains fixed.
Before treating unchanged FPS as evidence of a CPU bottleneck, check whether a game limiter, driver limiter, V-Sync behavior or another presentation limit is holding the rate at a fixed ceiling.
Why DLSS, FSR or lower render scale sometimes do almost nothing
Upscaling technologies reduce the resolution of part of the rendering workload and reconstruct the final image. That is highly useful when pixel rendering is expensive.
But if the CPU or simulation already determines the frame interval, reducing GPU pixel work may not meaningfully increase the base rendered frame rate.
This is why a game can show almost the same FPS at native resolution and at a much lower internal render resolution. The GPU received spare capacity, but the next frame still cannot start or finish sooner because another dependency is slower.
Frame Generation is a special case
Frame Generation complicates the usual FPS interpretation because generated frames can increase displayed frame output without requiring the CPU to simulate every generated frame.
NVIDIA explicitly documents this as one of the reasons DLSS Frame Generation can raise displayed frame rate in CPU-limited scenarios. That does not mean the original CPU bottleneck disappeared; it means the presentation pipeline can produce additional frames beyond the CPU's native simulation/render submission rate.
For diagnosis, separate base rendered performance, generated-frame output and input latency instead of treating one FPS counter as the whole system.
Responsiveness and FPS are not the same measurement
A CPU or GPU bottleneck also affects latency differently. NVIDIA Reflex documentation separates the latency pipeline into stages including input, simulation, render submission, driver, render queue and GPU rendering.
That is useful because a graphics change can improve GPU render time while leaving simulation or CPU submission time almost unchanged.
So the correct question may not be “Did FPS rise?” but “Did the part of the pipeline I care about get faster?”
The Wrong-Bottleneck Diagnostic
When Low settings and Ultra settings perform almost the same
Do not optimize from the settings menu alone
Graphics presets are designed for usability, not for exposing the engine's performance architecture.
A “Medium” preset may change ten unrelated variables at once. If performance improves, you still do not know which change mattered. If it does not improve, one CPU-heavy or streaming-heavy option may still dominate.
For troubleshooting, individual changes are slower but much more informative.
A practical tuning order
Tune the bottleneck instead of the label
What would change this answer?
The exact bottleneck can change from scene to scene. An indoor corridor may be GPU-limited while a dense city or strategy battle becomes CPU-limited. The diagnosis should therefore target the workload that actually causes the performance problem.
Frame Generation, dynamic resolution, engine-level adaptive quality and future scheduling systems can also make simple FPS scaling less intuitive. The core method still holds: change one workload, observe the response and identify which stage stopped improving.
Limitations
This article provides a diagnostic framework, not a universal mapping of every graphics setting to CPU or GPU cost. Engine architecture determines the real workload.
Utilization percentages alone cannot prove a bottleneck. Timing traces, repeatable tests and the response to controlled setting changes provide stronger evidence.
Conclusion
If Low and Ultra deliver nearly the same FPS, do not keep lowering random settings.
Use the lack of scaling as evidence. Test resolution, inspect CPU/GPU timing, check caps, then target the settings that affect the limiting workload. Performance tuning becomes much easier once you stop asking “Which setting is expensive?” and start asking “Which component is preventing the next frame from finishing sooner?”
FAQ
Graphics settings, CPU bottlenecks and low GPU usage
Why does lowering graphics settings not increase my FPS?
Why do 1080p and 1440p give me almost the same FPS?
Does low GPU usage always mean a CPU bottleneck?
Can a game be CPU-bound when total CPU usage is below 100%?
Which graphics settings affect the CPU?
Why does upscaling not improve FPS in some games?
Glossary
Key bottleneck terms
- CPU-bound
- A performance state in which CPU-side work or submission prevents frames from being produced faster even if the GPU has additional capacity.
- GPU-bound
- A performance state in which GPU execution consumes the limiting portion of the frame budget.
- Scaling response
- The change in performance produced by changing a workload such as resolution or graphics quality.
- GPU Busy
- An Intel PresentMon metric that helps compare GPU execution time with total frame timing to evaluate CPU/GPU balance.
- Bottleneck Response Test
- A Figure Rocks method that uses controlled setting changes and timing measurements to identify which workload limits performance.
- Setting Sensitivity Map
- A Figure Rocks planning model that groups game settings by the types of CPU, GPU, memory or streaming work they commonly influence.
Primary sources
Intel — Locate and Resolve CPU-GPU BottlenecksOfficial Intel guidance on CPU/GPU imbalance, scene-dependent bottlenecks and how resolution and draw-distance settings can affect different workloads.
Intel — PresentMonOfficial Intel performance-monitoring tool with GPU Busy, CPU/GPU balance, real-time graphs, percentiles and telemetry.
NVIDIA Developer — Reflex SDKOfficial NVIDIA documentation separating latency stages and describing render-queue and CPU/GPU timing behavior.
NVIDIA Technical Blog — CPU Threading and Game PerformanceOfficial NVIDIA developer analysis of CPU-bound game workloads, thread scheduling and CPU-side performance constraints.
NVIDIA — Ada GPU Science / DLSS 3Official NVIDIA technical material explaining CPU-limited game behavior and why Frame Generation can raise displayed FPS without requiring the CPU to render every generated frame.
Related Articles

DirectStorage 1.4 Does Not Make Your SSD Decompress Games: What Zstd and GPU Decompression Actually Do
DirectStorage 1.4 adds Zstandard compression, GPU decompression and a new Game Asset Conditioning Library, but the SSD itself is still only one part of the loading pipeline. This guide explains what the SSD, DirectStorage, CPU, GPU and game engine each actually do.
Storage and Streaming: Reduce Load Times Without Creating Stutter
Fast storage helps only when streaming behavior is stable. This guide explains how IO affects stutter and what to change first.
NVIDIA Reflex Basics: When It Helps (And When It Does Nothing)
Reflex reduces render queue delay when the game is GPU-bound and stable. Learn the practical conditions where it helps and the traps that make it pointless.
Router Checklist v2: The 12 Settings That Prevent Lag Spikes
Most lag spikes come from load and instability, not ‘bad ping’. Use this router checklist to stabilize latency under load before buying new gear.

RTX Neural Texture Compression Is Not Upscaling: How AI Can Trade Texture Memory for GPU Compute
NVIDIA RTX Neural Texture Compression changes how game materials can be stored. Instead of keeping every texture channel only as conventional texels, a material can be compressed into compact latent data and a small neural decoder, then reconstructed by the GPU when needed.
Router Checklist for Gaming: The Settings That Actually Matter
Most router tweaks don’t help. These settings do: queue management under load, stable Wi-Fi behavior, and avoiding features that add latency or instability.
HDR vs SDR Decision Matrix: When HDR Helps and When SDR Wins
HDR is not always better. Use this simple decision matrix to pick HDR or SDR per game based on readability, stability, and your display’s real behavior.
VRAM Usage Is Not VRAM Requirement: Why a Full Memory Meter Does Not Tell the Whole Story
Seeing 7.8 GB used on an 8 GB graphics card can look like proof that a game has run out of VRAM. It is not that simple. This guide explains VRAM capacity, residency budgets, working sets, shared memory and how to tell whether memory pressure is actually causing stutter.
Why PC Games Stutter When Compiling Shaders — and How Advanced Shader Delivery Changes It
Shader stutter happens when a PC game has to compile GPU programs at the wrong moment. Microsoft Advanced Shader Delivery moves much of that work off the player’s PC by preparing hardware-specific shaders ahead of time and delivering them with the game.