
Why 120 FPS Can Still Feel Bad: Frame Time, 1% Lows and Stutter Explained
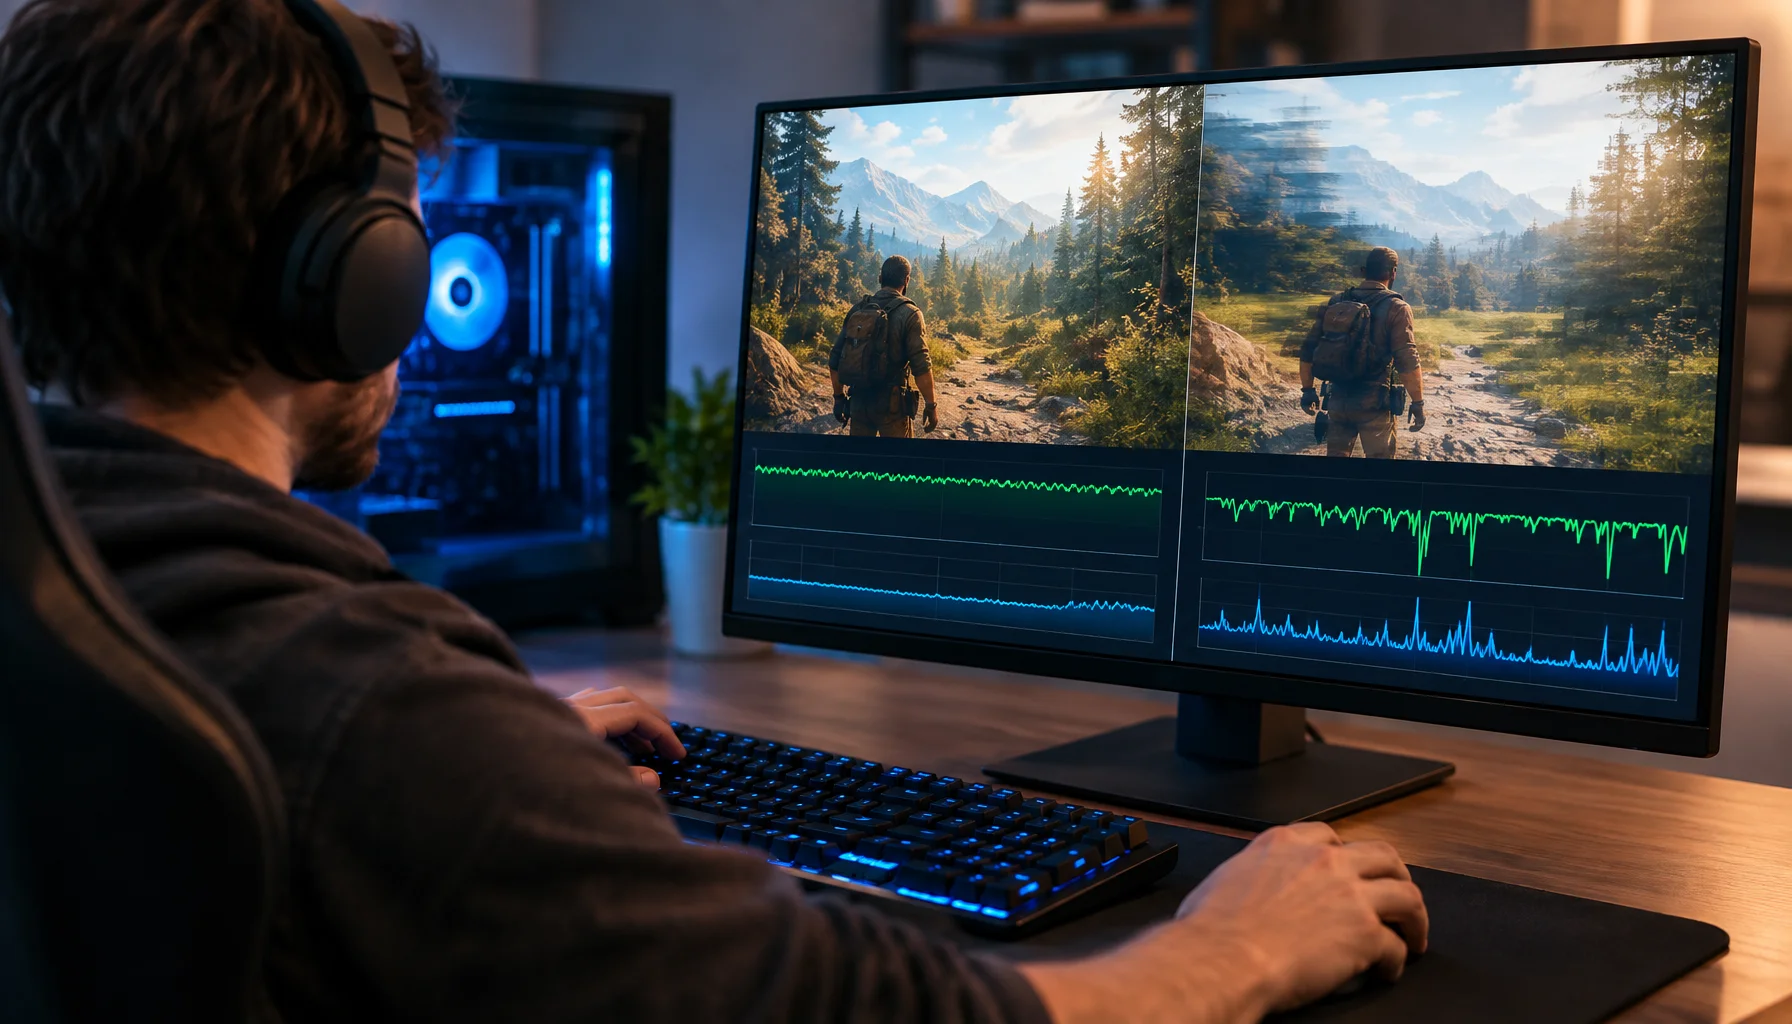
A game can report 120, 144 or even 200 FPS and still feel rough. The reason is simple: average frame rate tells you how many frames were produced over time, but it does not tell you whether those frames arrived evenly. A few long frames can create visible hitching or micro-stutter even when the average FPS number looks excellent.
FPS is an average; frame time is the rhythm
FPS tells you how many frames are completed per second. Frame time tells you how long an individual frame takes.
The rough conversion is simple: frame time in milliseconds is approximately 1000 divided by FPS. At 60 FPS, the frame budget is about 16.7 ms. At 120 FPS it is about 8.3 ms. At 144 FPS it is about 6.9 ms.
But those numbers are only meaningful if frame delivery is reasonably consistent. A sequence of 7 ms, 7 ms, 7 ms, 35 ms, 7 ms, 7 ms can still average to a high FPS while producing a noticeable hitch.
The Smoothness Triangle
Three different things determine how fast a game feels
A system can be strong in one corner and weak in another. High FPS with unstable frame times can feel stuttery. Stable rendering with very high latency can feel smooth but sluggish. Good performance tuning has to identify which corner is actually failing.
Why average FPS hides stutter
Two sessions can have the same average FPS and feel different
| Stable session | Unstable session | |
|---|---|---|
| Average FPS | 120 FPS | 120 FPS |
| Most frame times | Around 8–9 ms | Mostly 5–7 ms |
| Slow frames | Few meaningful spikes | Repeated 25–50 ms spikes |
| Player experience | Consistent motion | Hitches despite the high average |
The unstable session can compensate for long frames by rendering many very fast frames between spikes. The average stays high, but the player notices the spikes rather than the arithmetic mean.
What 1% lows are trying to show
Low-FPS and percentile metrics exist because average FPS alone cannot describe the slow end of the frame distribution.
NVIDIA FrameView reports average FPS together with 1% Low and 0.1% Low metrics. Its documentation describes 1% Low as the average of the slowest 1% of frames, and notes that the closer the low-FPS value is to the average, the more consistent the experience tends to be.
NVIDIA also exposes percentile-based metrics such as the frame rate separating the slowest 1% of frames from the faster 99%. These are related concepts, but not every benchmark tool implements or labels low-FPS statistics in exactly the same way.
Frame-time graphs are often more useful than one summary number
A frame-time graph shows the timing of frames across the capture. A flat or narrow band usually indicates consistent delivery. Tall isolated spikes reveal hitches. Repeating waves can point to periodic background work, streaming, synchronization or another recurring workload.
Intel PresentMon is designed around this type of analysis. Intel's current tool can show real-time performance graphs, percentiles, moving-window averages and GPU telemetry, and it supports DirectX, OpenGL and Vulkan applications.
NVIDIA FrameView likewise measures frame rate and frame time and can write detailed capture data to logs for later analysis.
The Frame-Time Stability Test
Diagnose whether high FPS is hiding stutter
CPU bottleneck and GPU bottleneck do not look identical
A low frame rate does not tell you which processor is responsible for the delay. The CPU prepares game and rendering work; the GPU executes graphics work. Either side can become the pacing limit.
Intel PresentMon's GPU Busy metric is specifically intended to help evaluate the relationship between GPU execution time and total frame time. This can help distinguish frames where the GPU is occupied for most of the interval from frames where a large part of the delay occurs elsewhere.
Simplified timing patterns
| Typical timing pattern | What it can suggest | |
|---|---|---|
| GPU-bound | GPU busy time is close to the frame interval | The graphics workload is consuming most of the available frame budget |
| CPU / pipeline constrained | Frame time grows while GPU busy time remains materially lower | The delay may be before GPU execution or elsewhere in the presentation pipeline |
| Intermittent event | Mostly stable timing with isolated large spikes | Streaming, shader compilation, background work, asset loading or another transient event may be involved |
Why a frame cap can sometimes feel smoother than maximum FPS
Running a game at the highest possible uncapped FPS can keep one part of the system near saturation. In some workloads, leaving headroom can reduce timing volatility and produce a more stable cadence.
That does not mean every game should be capped to the same number. The useful test is empirical: capture the same workload uncapped and at one or more sensible caps, then compare frame-time stability and latency.
A lower average with substantially tighter frame delivery can feel better than a higher average punctuated by frequent spikes.
Common causes of high-FPS stutter
| Cause class | What you may see | What to test |
|---|---|---|
| Shader or pipeline compilation | Spikes tied to first-time effects, locations or actions | Repeat the same sequence and compare later passes |
| Asset / world streaming | Spikes when entering areas or loading new content | Storage, texture settings, world-streaming behavior |
| CPU scheduling / background work | Irregular spikes unrelated to GPU load | Background processes, overlays, recording, CPU saturation |
| GPU saturation | Consistently high GPU execution time | Lower expensive graphics settings or test a frame cap |
| Memory pressure | Increasing hitching under heavy VRAM/RAM use | Texture level, resolution, background applications, working-set behavior |
| Presentation / synchronization | Cadence problems around refresh or presentation modes | V-Sync, VRR, frame cap and display-mode combinations |
| Driver or game regression | Problem appears after a specific update | Compare versions or official known-issue notes where practical |
Shader compilation is a special case
Some stutter is not a simple steady-state performance problem. A workload can run comfortably at high FPS until the game performs expensive work that occurs only at particular moments.
Shader or pipeline compilation is one example. If a hitch appears the first time a specific effect or area is encountered but becomes smaller or disappears on later passes, that pattern is different from a GPU that is continuously too slow.
This is why repeatable captures matter. One average number over an entire session can mix steady rendering and one-time events into a result that explains neither.
VRR does not repair bad frame times
Variable refresh rate can align display refresh timing more closely with variable frame delivery and reduce visible tearing or judder within its operating range.
But VRR does not make a 40 ms frame become an 8 ms frame. A large rendering or CPU stall remains a large stall. Display technology can improve presentation; it cannot remove work that delayed the frame in the first place.
Why 0.1% lows can become noisy
Metrics focused on a very small fraction of frames are useful for exposing severe outliers, but they also become sensitive to capture duration and one-off events.
A short capture containing one loading transition may produce a dramatically different extreme-low result than a longer, repeatable gameplay run. That does not make the metric useless; it means the test methodology matters.
A practical benchmark protocol
Measure a game without fooling yourself
The Frame-Time Stability Scorecard
What to look for before calling a game “smooth”
| Healthy signal | Warning signal | |
|---|---|---|
| Average throughput | Meets your performance target | Average hides repeated drops below the useful range |
| Slow-frame tail | Reasonably close to average for the workload | Large persistent gap between average and low-FPS metrics |
| Frame-time trace | Narrow, mostly stable band | Frequent tall spikes or recurring oscillation |
| Repeatability | Similar pattern across comparable runs | Result changes wildly between identical tests |
| Timing diagnosis | CPU/GPU behavior matches the suspected constraint | Optimization is being applied without identifying the bottleneck |
What would change this answer?
The exact metrics available depend on the operating system, graphics API, hardware and measurement tool. Future presentation systems or frame-generation pipelines can also require additional distinctions between rendered, generated and displayed frames.
The core principle is unlikely to change: a throughput average cannot fully describe timing consistency. As long as interactive graphics are delivered as a sequence of frames, the distribution and timing of those frames matter.
Limitations
This article is a diagnostic framework, not a claim that every stutter has the same root cause. Game engines, APIs, operating systems, drivers and rendering pipelines differ.
Low-FPS metrics should also be interpreted within the methodology of the tool that produced them. Cross-tool comparisons can be misleading when the statistical definitions or capture pipelines differ.
Conclusion
If a game shows high FPS but still feels bad, stop staring at the average.
Measure the frame times. Inspect the slow tail. Find out when the spikes happen. Compare CPU and GPU timing. Then change one variable and repeat the same workload. Smoothness is not just how many frames your system can produce. It is how consistently those frames reach you.
FAQ
FPS, frame time and stutter
Why does 120 FPS still feel stuttery?
What is frame time?
What does 1% low FPS mean?
Is 1% low more important than average FPS?
Can VRR fix micro-stutter?
Should I cap FPS to reduce stutter?
Glossary
Key performance terms
- Frame time
- The time associated with producing or presenting an individual frame, usually expressed in milliseconds.
- Average FPS
- A throughput average describing the number of frames produced over a measured interval.
- 1% Low
- A slow-frame performance metric. Exact calculation can differ by tool; NVIDIA FrameView describes its 1% Low as the average of the slowest 1% of frames.
- Frame-time spike
- A frame whose duration is substantially longer than surrounding frames, often perceived as a hitch or stutter.
- GPU Busy
- A PresentMon timing metric used to compare GPU execution time with the broader frame interval and help diagnose CPU/GPU balance.
- Frame-Time Stability Test
- A Figure Rocks workflow for evaluating average throughput, frame-time distribution, slow-frame metrics and CPU/GPU timing under repeatable conditions.
Primary sources
Intel — PresentMonOfficial Intel performance-monitoring tool with real-time graphs, percentiles, GPU telemetry, GPU Busy and support for major graphics APIs.
NVIDIA — FrameViewOfficial NVIDIA tool for measuring frame rate, frame time, power and performance-per-watt, using PresentMon-based analytics.
NVIDIA — FrameView User GuideOfficial documentation defining average FPS, percentile metrics, 1% Low and 0.1% Low and explaining how consistency relates to stutter.
Intel — Graphics API Developer and Optimization GuideOfficial Intel guidance covering presentation modes, CPU scheduling considerations and the use of PresentMon for frame-presentation analysis.
Related Articles
Smoothness: Frame Pacing Matters More Than FPS
Smoothness is consistent timing, not just higher numbers. Here’s how to think in frametimes and eliminate the ‘micro-stutter’ feel.
Frame Pacing: Why 120 FPS Can Feel Worse Than 60 (Smoothness Explained)
Smoothness is consistent timing, not peak FPS. Learn what frame pacing is, how frametimes create stutter, and the practical baseline that fixes feel.
CPU Stutter vs GPU Stutter vs Shader Stutter: How to Tell What You Have
Not all stutter is the same. Learn the three common stutter types, what they feel like, and the fastest way to diagnose before you change settings.
Frame Cap Recipes: Stable Targets for VRR and Non-VRR Setups
A good cap feels better than unstable peaks. Use these simple cap recipes to stabilize frame pacing for VRR and non-VRR displays.
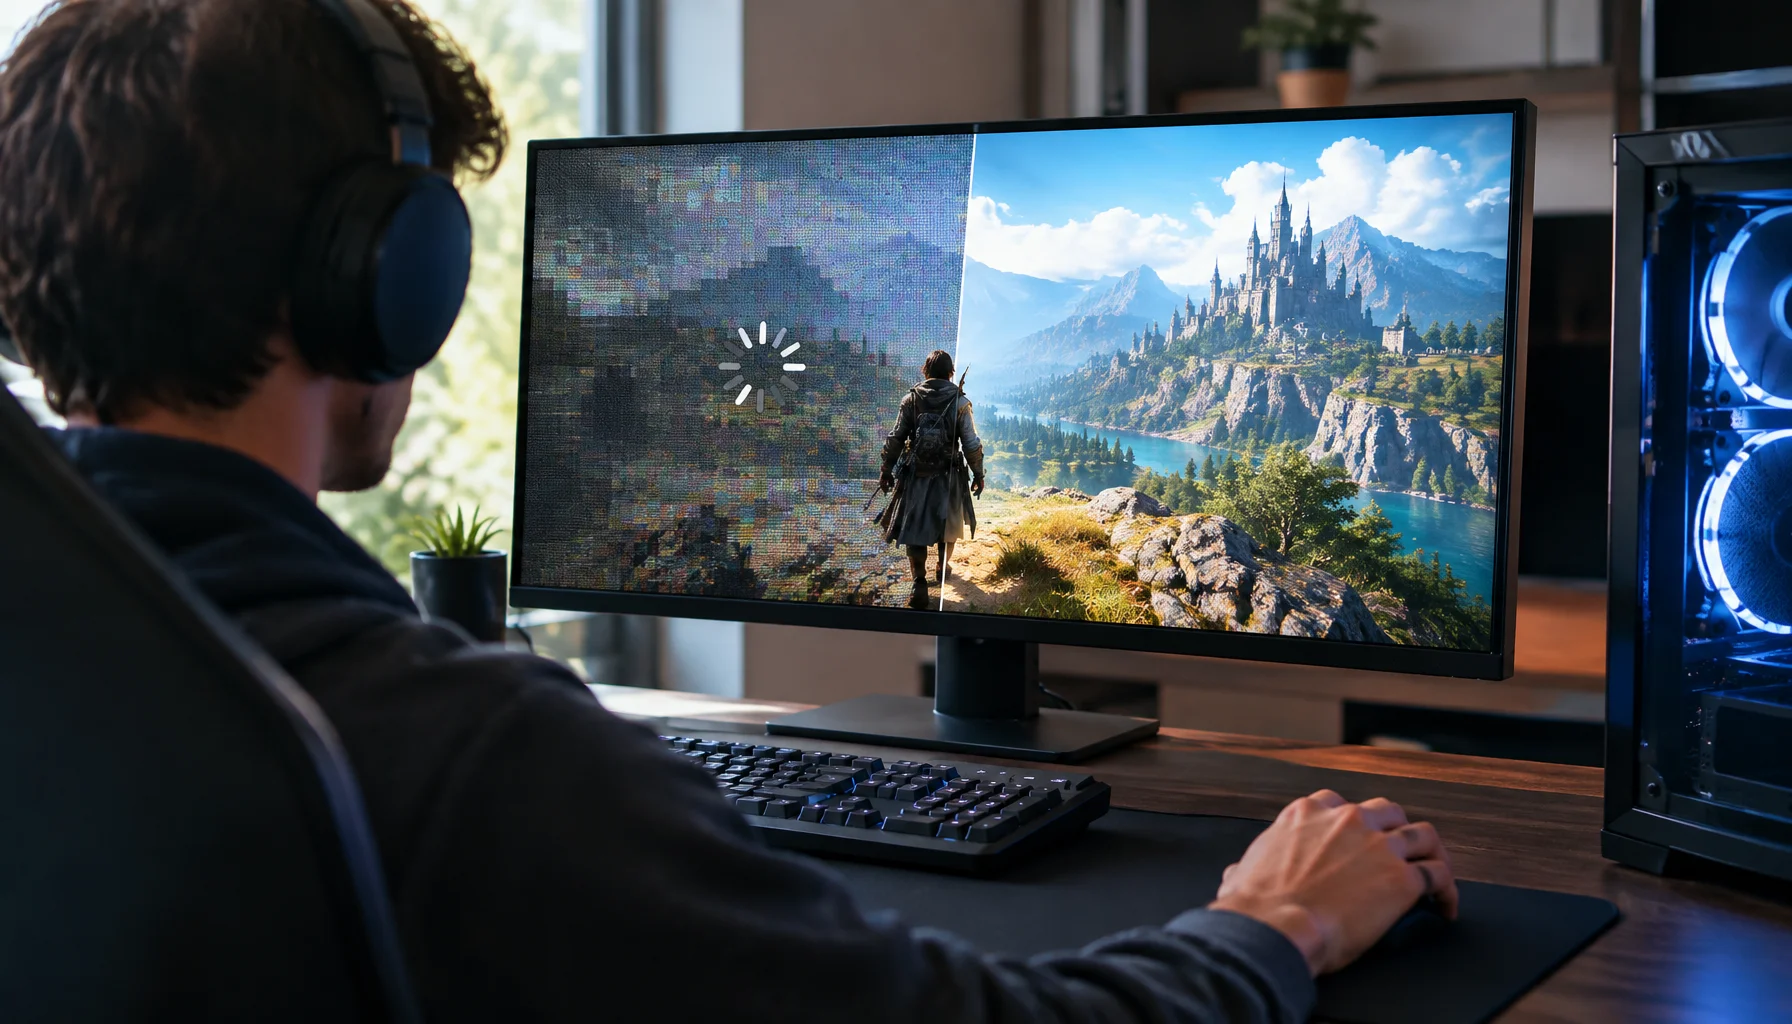
Why PC Games Stutter When Compiling Shaders — and How Advanced Shader Delivery Changes It
Shader stutter happens when a PC game has to compile GPU programs at the wrong moment. Microsoft Advanced Shader Delivery moves much of that work off the player’s PC by preparing hardware-specific shaders ahead of time and delivering them with the game.
Frame Pacing: Why Smoothness Is About Frametime, Not FPS
High FPS can still feel bad if timing is uneven. Learn what frame pacing is, what breaks it, and the fix order that restores smooth feel.
Frame Pacing: Why 120 FPS Can Still Feel Bad
Smoothness is timing, not a number. Learn what frame pacing is, why bad frametimes feel rough even at high FPS, and the practical fix order.
Frame Pacing: Why 60 FPS Can Feel Worse Than 50 (Consistency Wins)
Smoothness is not just FPS. It is frame pacing. Learn why consistent frametimes feel better than higher but unstable FPS and how to stabilize timing.

DLSS 4.5 6X: Why 300 FPS Does Not Mean the Game Is Rendering 300 Frames
DLSS 4.5 can generate up to five additional frames for every traditionally rendered frame on supported RTX 50 Series GPUs. This guide explains the difference between rendered FPS and displayed FPS, why CPU bottlenecks can be bypassed at the presentation layer, and why latency still needs to be measured separately.
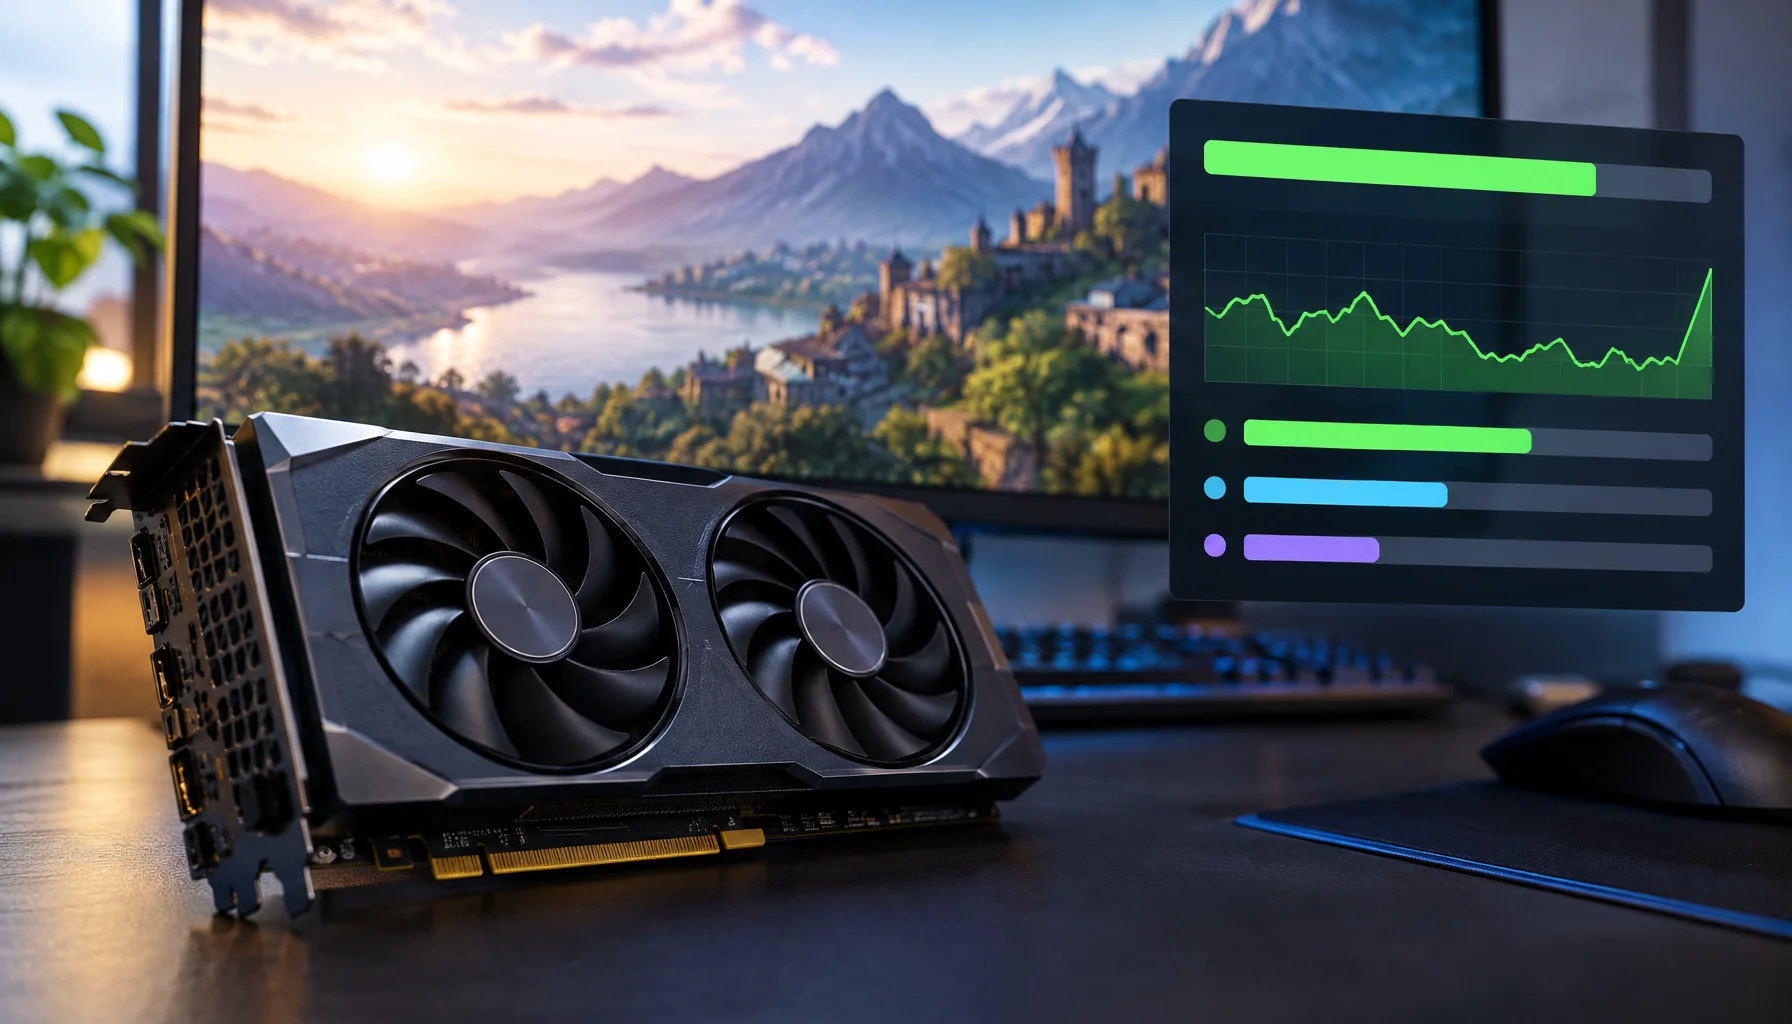
VRAM Usage Is Not VRAM Requirement: Why a Full Memory Meter Does Not Tell the Whole Story
Seeing 7.8 GB used on an 8 GB graphics card can look like proof that a game has run out of VRAM. It is not that simple. This guide explains VRAM capacity, residency budgets, working sets, shared memory and how to tell whether memory pressure is actually causing stutter.
Shader Stutter: Why First Runs Hitch and How to Reduce It
Shader stutter happens when new effects compile in real time. Learn how to identify it fast and the practical ways to reduce hitches without placebo tweaks.